Concept v2
Clicking the Grafana tile on the home page lands you on a pre-configured dashboard. It shows the most important values from the attached IDEA-4S sensor at a glance.
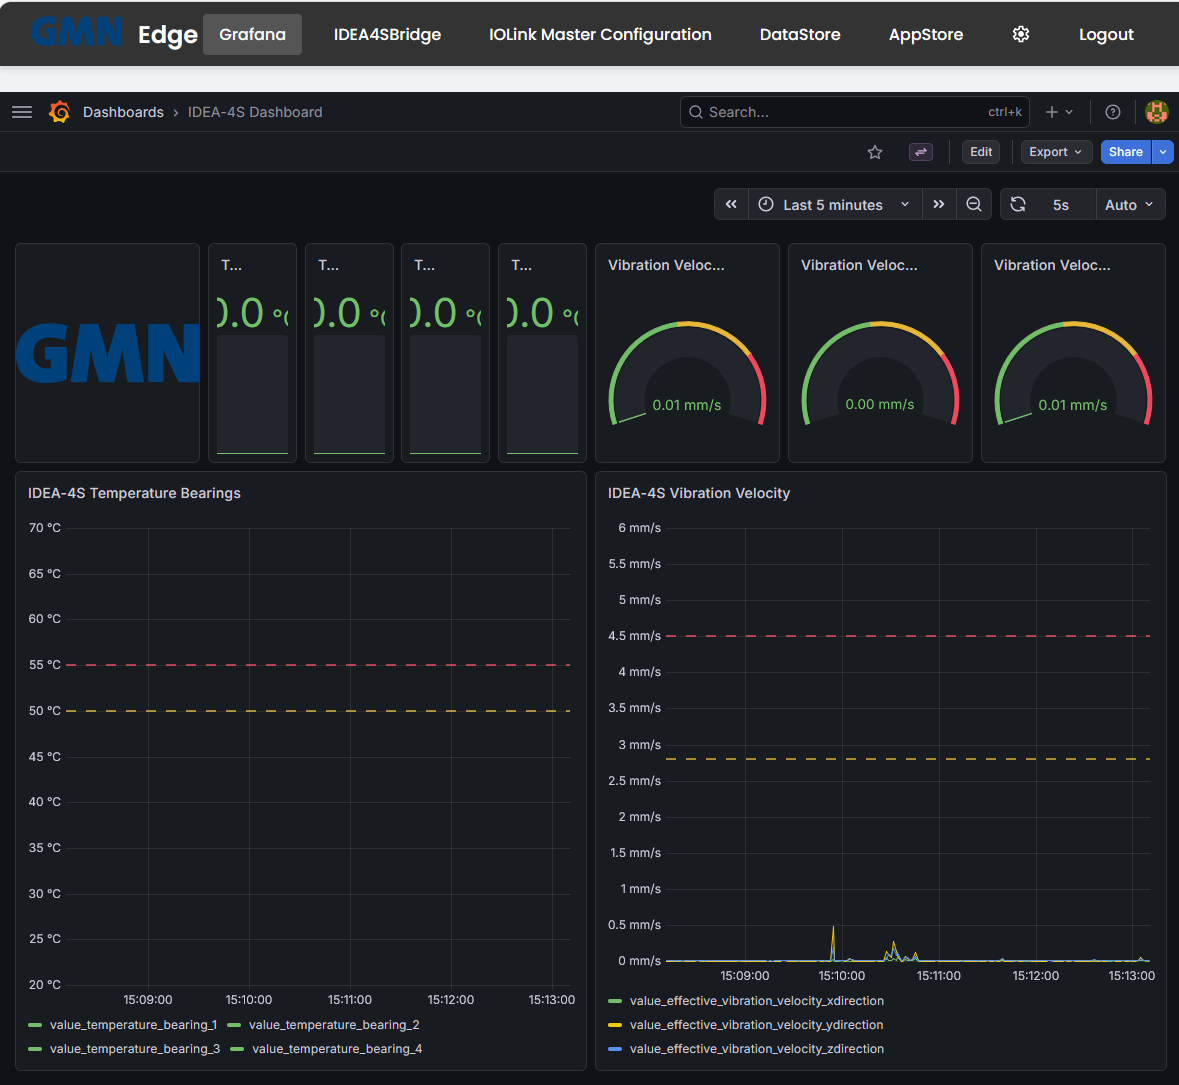
Dashboard layout
- Four bearing-temperature stat tiles top-left: Bearing 1 through Bearing 4, in °C. With live data the tiles colour according to the configured thresholds.
- Three vibration-velocity gauges top-right: X, Y, Z axes, in mm/s. The scale runs green → yellow → red as values approach the IODD-defined thresholds.
- Time-series panel “IDEA-4S Temperature Bearings” bottom-left: all four bearings over the selected time range. The red dashed line is the alarm threshold; the yellow one the fault threshold.
- Time-series panel “IDEA-4S Vibration Velocity” bottom-right: the three axes over the selected time range.
Use the time-range picker top-right (here: “Last 5 minutes”) to switch between live and historical views.
Where does the data come from?
IDEA-4S sensor
    │ (IO-Link, RAW)
    ▼
IFM IO-Link master  ──── publishes via MQTT ──────┐
                                                  ▼
                                       Mosquitto broker
                                              │
                                              ▼
                                          DataStore  ── persists ─→  PostgreSQL
                                              │
                                              ▼
Grafana- The IO-Link master polls the IDEA-4S cyclically and sends each change as an MQTT message. The configured topics are visible in IOLink Master Configuration → Notification.
- DataStore subscribes to these topics, validates them against the schema, and writes the values into the local PostgreSQL on the edge.
- Grafana reads from the PostgreSQL and visualises it. The dashboard ships with the edge; you can clone and customise it.
Custom dashboards
Click Dashboards → New in Grafana’s left sidebar, or duplicate the shipped dashboard, to build your own views. Custom dashboards survive firmware updates — they are not overwritten by the repo seed.
When the dashboard stays empty
If you see axes but no data, the data pipeline is usually broken somewhere:
- Open Settings → Diagnosis and check that
datastore,postgres, andmosquittoare green. - Open IOLink Master Configuration → Notification and confirm there is at least one MQTT subscription to
172.16.9.112:1883/teststand/idea-4s(example topic). - If both are OK but Grafana is still empty: this can be a known “memory-loss” case — refer to internal documentation or contact Brinkhaus support.