What it is
Every openXEdge is preconfigured to phone home to the Brinkhaus FleetManager as soon as it can reach the internet. That is the foundation for everything you might want to be remotely supported on — remote diagnosis, update recommendations, emergency repair.
Prerequisites
Three conditions need to hold at the same time:
- 24 V power at the edge.
- Eth2 (middle port) is connected to a DHCP server that hands out an office IP and allows internet access — typically an office switch behind your company router.
- The machine ID is set on the edge (see First boot walkthrough, step 2 — device activation).
When all three hold, the edge sends a heartbeat to the FleetManager every few minutes with versions, IPs, and self-diagnosis. Brinkhaus personnel then see your edge in the central overview:
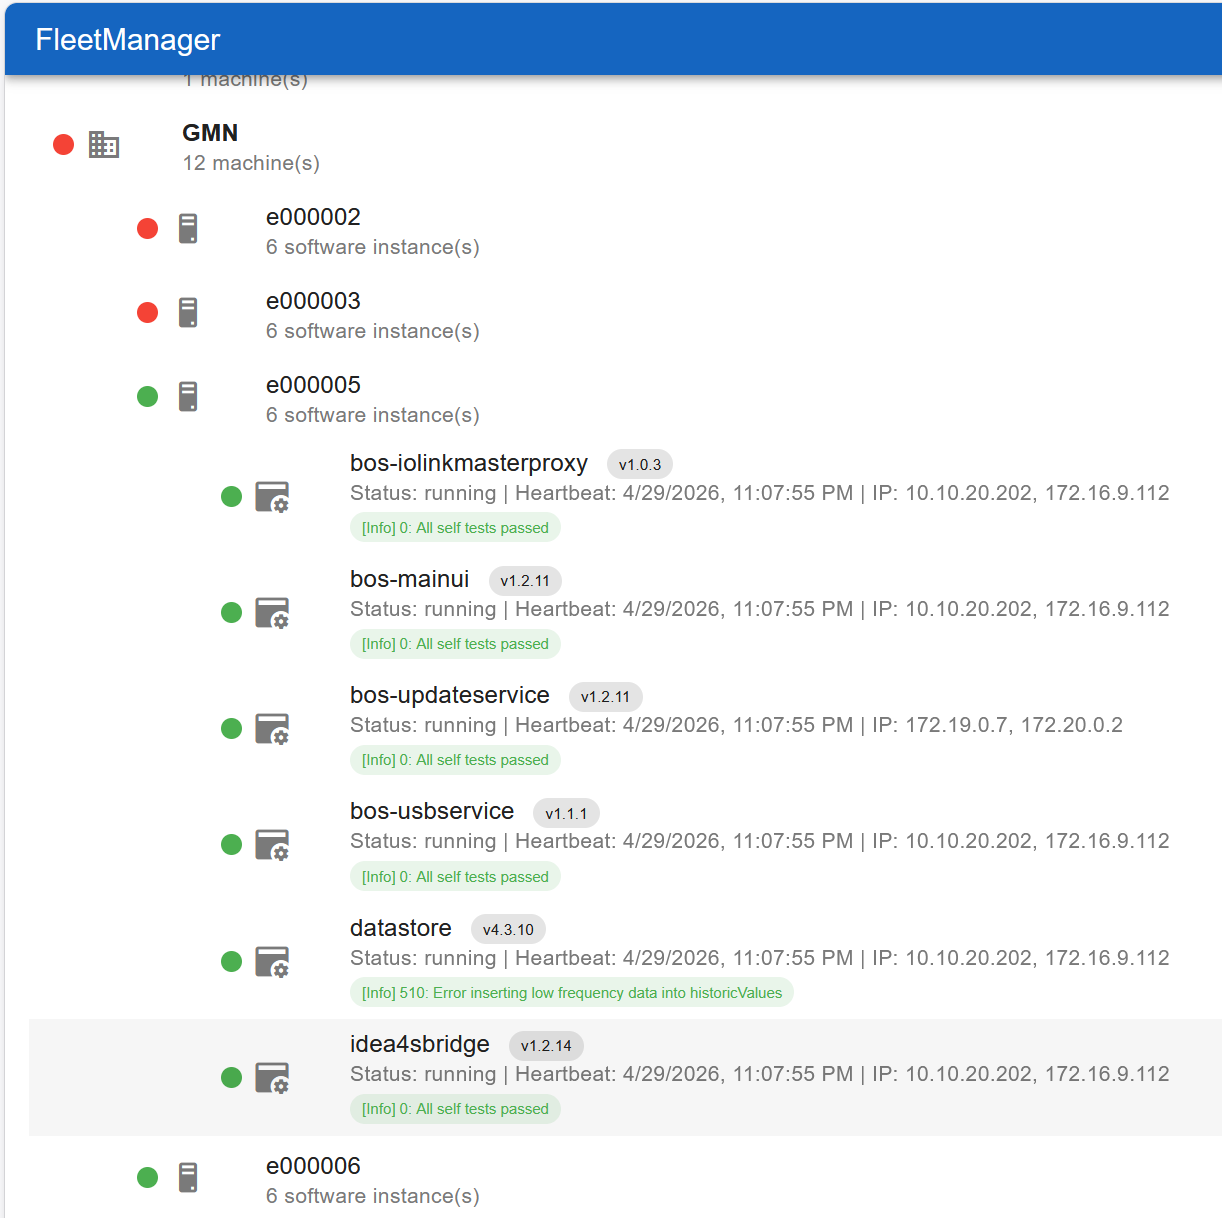
What Brinkhaus personnel can see
Per edge in the central view:
- Status dot (green/yellow/red) — at a glance, is the edge still online and does it report problems.
- Version levels of every running container (
bos-mainui,bos-updateservice,datastore,idea4sbridge, …). - Last heartbeat time — anything older than a few minutes means the edge is offline or has lost internet.
- All current IPs — useful when the office DHCP rotates the lease.
- Self-diagnosis messages — the same codes you see under Read diagnosis.
What the edge actually transmits
Deliberately minimal:
- Version levels, IPs, heartbeat time, self-diagnosis codes.
- No sensor measurements, no process data, no personal data.
That is: the FleetManager is a maintenance plane for the edge itself, not an archive of your production data. Your measurements stay on the edge (and wherever you actively export them).
Edge-side control
On the edge you see your part under Settings → Fleetmanagement. Customer Name is read-only (set by the stream — e.g. gmn); Machine is the ID identifying this edge in the fleet. More on the tutorial page First boot walkthrough.
When an edge goes offline
In the central view (image above) edges whose last heartbeat is too old appear with a red status dot (in the example e000002 and e000003). Brinkhaus personnel see this immediately and reach out proactively — typical causes are failed switches, forgotten power, or an office DHCP that rotated its pool.
Asking for help
Send the hotline:
- the machine ID (visible on the edge under Settings → Fleetmanagement and also the name in the fleet overview),
- a brief symptom (“Grafana empty”, “update keeps failing”),
- the last action you tried.
The hotline reads the diagnosis in the FleetManager in parallel — usually that’s enough to locate the problem without anyone going on-site.